  1. Posts/

2025 on track to be joint-second warmest year

·5 mins·
Notaspampeanas
Climate Change Global Warming Climate Copernicus Climate Change Service Winter 2025
Notaspampeanas
Author
Notaspampeanas
Digging on curiosity and science.
Table of Contents

Findings in the latest Climate Bulletin published by the Copernicus Climate Change Service (C3S) confirm November 2025 as the third-warmest November globally. With just one month left in the calendar year, this means 2025 will finish as the second- or third-warmest year on record after 2024, potentially tied with 2023, currently the second-warmest year. It also sets the global three-year average temperature for 2023–2025 on track to exceed 1.5°C above pre-industrial levels for the first time in the instrumental period, according to the ERA5 dataset.

Global-average surface air temperature anomalies relative to 1991-2020 for each November, all months, and running 12-month averages from 1979 to 2025. Data source: ERA5. Credit: C3S/ECMWF
Global-average surface air temperature anomalies relative to 1991-2020 for each November, all months, and running 12-month averages from 1979 to 2025. Data source: ERA5. Credit: C3S/ECMWF.

“For November, global temperatures were 1.54°C above pre-industrial levels, and the three-year average for 2023–2025 is on track to exceed 1.5°C for the first time. These milestones are not abstract – they reflect the accelerating pace of climate change and the only way to mitigate future rising temperatures is to rapidly reduce greenhouse gas emissions.”
Samantha Burgess, Strategic Lead for Climate, ECMWF

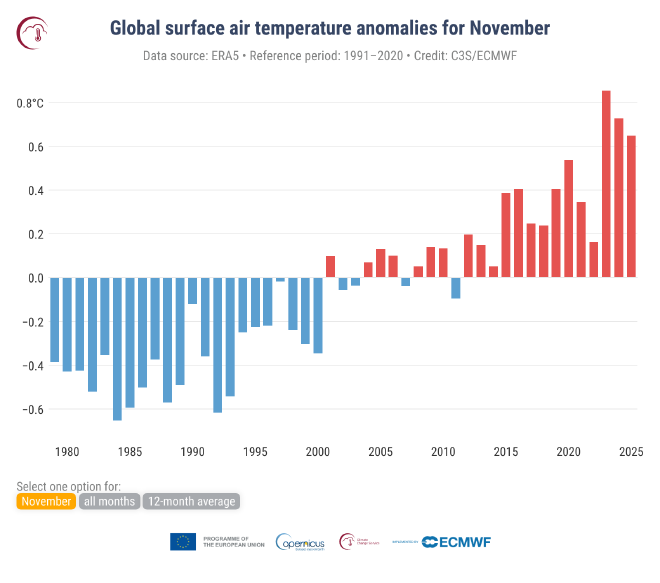
Third-warmest November on record globally
#

November 2025 saw an average surface air temperature of 14.02°C, 0.65°C above the 1991–2020 average for the month. It was 0.20°C cooler than November 2023 – the warmest November on record – and 0.08°C cooler than November 2024, the second warmest.

Globally, November 2025 was 1.54°C warmer than the estimated 1850–1900 pre-industrial average, making it the 28th month in the entire ERA5 dataset to surpass 1.5°C, and the second month since April 2025 to do so after October. From January to November, the global average temperature anomaly was 0.60°C above the 1991–2020 average, equivalent to 1.48°C above the pre-industrial baseline – identical to 2023.

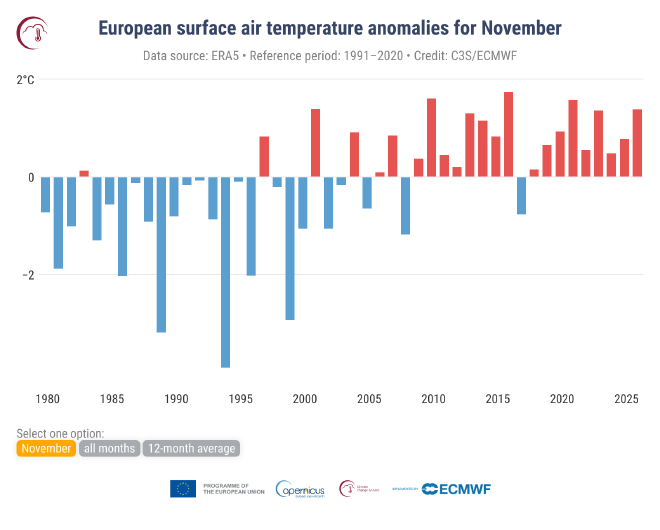
Over Europe, the average temperature was 5.74°C, 1.38°C above the 1991–2020 average for November, making it the fifth-warmest November in the European record. The most pronounced above-average temperatures were observed over eastern Europe, Russia, the Balkans and Türkiye. In contrast, below-average temperatures were mainly seen over northern Sweden and Finland, Iceland, and parts of northern Italy and southern Germany.

European-mean surface air temperature anomalies relative to 1991-2020 averaged over European land for each November, all months, and running 12-month averages from 1979 to 2025. Use the grey and yellow toggles to change the temporal sampling. Data source: ERA5. Credit: C3S/ECMWF.

Outside Europe, temperatures were most above average over the polar regions. This includes northeastern Canada and the Canadian archipelago, much of the United States, the Arctic Ocean and East Antarctica.

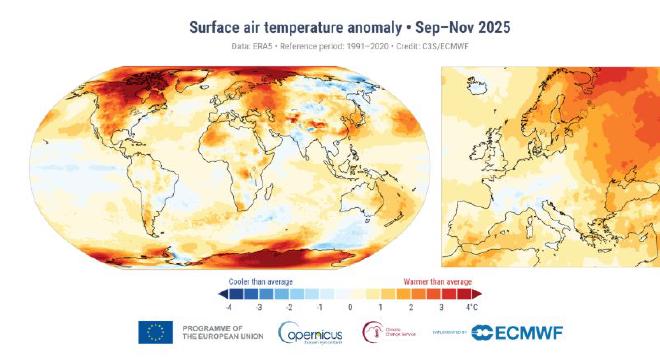
Boreal autumn ranks third warmest
#

The 2025 boreal autumn season (September–November) was the third warmest on record globally, cooler only than the autumns of 2023 and 2024. Temperatures were mostly above average across the world, with particularly strong positive anomalies over northern Canada, the Arctic Ocean and Antarctica.

Surface air temperature anomaly for the boreal autumn from September to November 2025 relative to the average for 1991-2020. Data source: ERA5. Credit: Copernicus Climate Change Service/ECMWF.

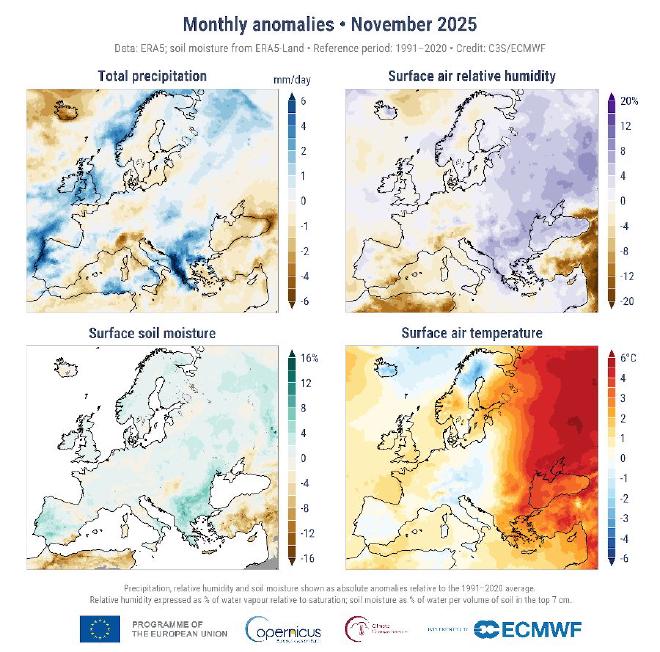
Europe sees heavy rainfall and drought conditions
#

Across Europe in November, wetter-than-average conditions impacted the UK, Ireland, Portugal, Spain, northwestern Russia and much of the Balkans, with Albania and Greece experiencing particularly heavy rainfall. Storm Claudia brought heavy rain and flooding to northwestern Spain and Portugal between 12 and 15 November, before extending to Ireland, Wales and England on 14–15 November, where it also caused local flooding.

In contrast, drier-than-average conditions were recorded in Iceland, southern Spain, northern Italy, central Germany and Sweden. Drought warnings persisted across southeastern Europe, especially in southwestern Russia, Ukraine and Türkiye.

Anomalies in precipitation, the relative humidity of surface air, the volumetric moisture content of the top 7 cm of soil and surface air temperature for November 2025 with respect to November averages for the period 1991-2020. The darker grey shading denotes where soil moisture is not shown due to ice cover or climatologically low precipitation. Data source: ERA5 and ERA5-Land. Credit: C3S/ECMWF.

Rest of the world
#

Beyond Europe, the bulletin reports wetter-than-average conditions in the southwest United States, parts of northern Canada, northwestern Russia, Taiwan, southern Africa, Madagascar and along coastal regions of Australia. South and southeast Asia experienced extreme rainfall and flooding resulting from a combination of tropical cyclones and heavy monsoon rains. In contrast, much of western and central Asia saw drier-than-average conditions in November, in addition to northern Mexico, the southeastern United States and southern Brazil.*

Slow growth of Arctic sea ice extent
#

Growth of the Arctic sea ice cover has been slower than average since the last week of October, leading to the second lowest monthly extent for November (12% below the 1991–2020 average). On 30 November, the daily extent ranked lowest for that date, at 9.74 million km².

Left: Average Antarctic sea ice concentration for November 2025. The white line denotes the climatological ice edge for November for the period 1991-2020. Right: Antarctic sea ice concentration anomaly for November 2025 relative to the November average for the period 1991-2020. Data source: ERA5. Credit: C3S/ECMWF.

Regionally, sea ice concentrations were much below average in the western Eurasian sector, particularly around Svalbard, Franz Josef Land and the Kara Sea, as well as in the northeastern Canadian sector. These low concentrations coincided with much-above-average surface air temperatures, pointing to the link between warm anomalies and reduced ice cover.

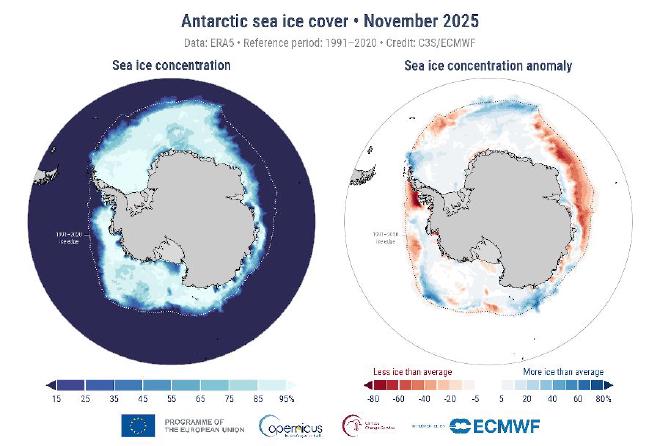
In the Antarctic, the monthly sea ice extent for November 2025 was 7% below the 1991–2020 average, ranking it as the fourth lowest November extent on record. Sea ice concentrations around Antarctica were most below average in the Bellingshausen Sea and the Indian Ocean sector.

The worst scenario
#

And if that were not enough with the panorama described by the bulletin derived from data from Copernicus, it was also reported that the inhabitants of this planet are approaching the ’limit’ of 1.5°C, faster than predicted by forecasters. The C3S global temperature trend monitoring app shows how quickly the world has approached the 1.5°C threshold since the Paris Agreement was adopted. When the Agreement was signed in December 2015, the tool indicated that 1.5°C would be reached around March 2042; In its latest update, it points instead to May 2029, less than four years away, clearly illustrating the rapid acceleration of global warming.

NdelT: Many thanks Copernicus Climate Service Bulletin!!!


Contact [Notaspampeanas](mailto: notaspampeanas@gmail.com)


Related

Pampean Cultural Agenda: November closes with a diversity of proposals
·7 mins
Notaspampeanas
La Pampa Cultural Agenda
Why some volcanoes don’t explode
·5 mins
Notaspampeanas
Volcanoes ETH Zurich
Theia and Earth Were Neighbors
·6 mins
Notaspampeanas
Planetary Science Geochemistry
La Pampa: Comprehensive activities to raise awareness about Diabetes
·4 mins
Notaspampeanas
La Pampa World Diabetes Day
La Pampa: Prevention of Child Labour: day of awareness and debate
·2 mins
Notaspampeanas
La Pampa Prevention of Child Labour Labor Relations
September is Healthy Aging Month
·3 mins
Notaspampeanas
September Healthy Aging Month National Institutes of Health