
Using the James Webb Space Telescope to monitor a broad spectrum of infrared light emitted by SIMP 0136 over two full rotation periods, the team was able to detect variations in cloud layers, temperature, and carbon chemistry that were previously hidden from view. The results provide crucial insight into the three-dimensional complexity of gas giant atmospheres within and beyond our solar system.
Rapidly rotating… but free-floating? #
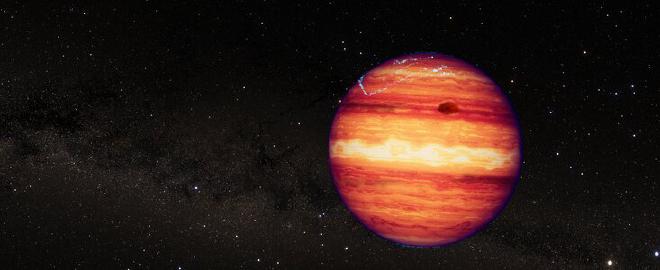
SIMP 0136 is a rapidly rotating, free-floating object roughly 13 times the mass of Jupiter, located in the Milky Way just 20 light-years from Earth. Although it is not classified as a gas giant exoplanet — it doesn’t orbit a star and may instead be a brown dwarf — SIMP 0136 is an ideal target for exo-meteorology: It is the brightest object of its kind in the northern sky. Because it is isolated, it can be observed directly and with no fear of light contamination or variability caused by a host star. And its short rotation period of just 2.4 hours makes it possible to survey very efficiently.
“We already knew that it varies in brightness, and we were confident that there are patchy cloud layers that rotate in and out of view and evolve over time,” explained Allison McCarthy, doctoral student at Boston University and lead author on a study published in The Astrophysical Journal Letters. “We also thought there could be temperature variations, chemical reactions, and possibly some effects of auroral activity affecting the brightness, but we weren’t sure.”
To figure it out, the team needed Webb’s ability to measure very precise changes in brightness over a broad range of wavelengths.
Charting thousands of infrared rainbows #
Using NIRSpec (Near-Infrared Spectrograph), Webb captured thousands of individual 0.6- to 5.3-micron spectra — one every 1.8 seconds over more than three hours as the object completed one full rotation. This was immediately followed by an observation with MIRI (Mid-Infrared Instrument), which collected hundreds of measurements of 5- to 14-micron light — one every 19.2 seconds, over another rotation.
The result was hundreds of detailed light curves, each showing the change in brightness of a very precise wavelength (color) as different sides of the object rotated into view.
“To see the full spectrum of this object change over the course of minutes was incredible,” said principal investigator Johanna Vos, from Trinity College Dublin. “Until now, we only had a little slice of the near-infrared spectrum from Hubble, and a few brightness measurements from Spitzer.”
The team noticed almost immediately that there were several distinct light-curve shapes. At any given time, some wavelengths were growing brighter, while others were becoming dimmer or not changing much at all. A number of different factors must be affecting the brightness variations.
“Imagine watching Earth from far away. If you were to look at each color separately, you would see different patterns that tell you something about its surface and atmosphere, even if you couldn’t make out the individual features,” explained co-author Philip Muirhead, also from Boston University. “Blue would increase as oceans rotate into view. Changes in brown and green would tell you something about soil and vegetation.”
Patchy clouds, hot spots, and carbon chemistry #
To figure out what could be causing the variability on SIMP 0136, the team used atmospheric models to show where in the atmosphere each wavelength of light was originating.
“Different wavelengths provide information about different depths in the atmosphere,” explained McCarthy. “We started to realize that the wavelengths that had the most similar light-curve shapes also probed the same depths, which reinforced this idea that they must be caused by the same mechanism.”
One group of wavelengths, for example, originates deep in the atmosphere where there could be patchy clouds made of iron particles. A second group comes from higher clouds thought to be made of tiny grains of silicate minerals. The variations in both of these light curves are related to patchiness of the cloud layers.
A third group of wavelengths originates at very high altitude, far above the clouds, and seems to track temperature. Bright “hot spots” could be related to auroras that were previously detected at radio wavelengths, or to upwelling of hot gas from deeper in the atmosphere.
Some of the light curves cannot be explained by either clouds or temperature, but instead show variations related to atmospheric carbon chemistry. There could be pockets of carbon monoxide and carbon dioxide rotating in and out of view, or chemical reactions causing the atmosphere to change.
“We haven’t really figured out the chemistry part of the puzzle yet,” said Vos. “But these results are really exciting because they are showing us that the abundances of molecules like methane and carbon dioxide could change from place to place and over time. If we are looking at an exoplanet and can get only one measurement, we need to consider that it might not be representative of the entire planet.”
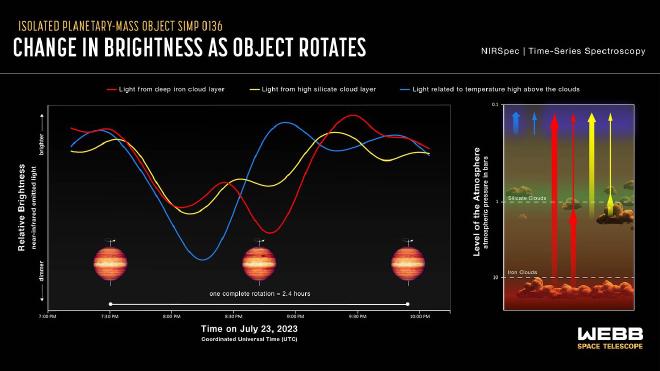
These light curves -you can see in the artist’s conception image- show the change in brightness of three different sets of wavelengths (colors) of near-infrared light coming from the isolated planetary-mass object SIMP 0136 as it rotated. The light was captured by Webb’s NIRSpec (Near-Infrared Spectrograph), which collected a total of 5,726 spectra — one every 1.8 seconds — over the course of about 3 hours on 23 July 2023 (SIMP 0136 completes one rotation every 2.4 hours).
The curve shown in red tracks the brightness of 0.9- to 1.4-micron light thought to originate deep in the atmosphere at a pressure of about 10 bars (about 10 times the air pressure at sea level on Earth), within clouds made of iron particles. The curve shown in yellow tracks the brightness of 1.4- to 2.3-micron light from a pressure of about 1 bar within higher clouds made of tiny grains of silicate minerals. The variations in brightness shown by these two curves is related to patchiness of the cloud layers, which emit some wavelengths of light and absorb others.
The curve shown in blue tracks the brightness of 3.3- to 3.6-micron light that originates high above the clouds at a pressure of about 0.1 bars. Changes in brightness of these wavelengths are related to variations in temperature around the object. Bright “hot spots” could be related to auroras that have been detected at radio wavelengths, or to upwelling of hot gas from deeper in the atmosphere.
The differences in shape of these three light curves show that there are complex variations in SIMP 0136’s atmosphere with depth as well as longitude. If the atmosphere varied around the object in the same way at all depths, the light curves would have similar patterns. If it varied with depth, but not longitude, the light curves would be straight, flat lines.
Note the graph shows the relative change in brightness for each given set of wavelengths over time, not the difference in absolute brightness between the different sets. At any given time, there is more light coming from the deep atmosphere (red light curve) than from the upper atmosphere (blue light curve).
SIMP 0136 is located within the Milky Way, about 20 light-years from Earth, in the constellation Pisces. It is the brightest isolated planet or brown dwarf visible from the Northern Hemisphere, and is thought to be about 200 million years old. The artist’s concepts are based on spectroscopic observations. Webb has not captured a direct image of the object.
This research was conducted as part of Webb’s General Observer (GO) Program 3548.
-
- The The JWST Weather Report from the Isolated Exoplanet Analog SIMP 0136+0933: Pressure-dependent Variability Driven by Multiple Mechanisms was published in Astrophysical Journal Letters. Authors: Allison M. McCarthy, Johanna M. Vos, Philip S. Muirhead, Beth A. Biller, Caroline V. Morley, Jacqueline Faherty, Ben Burningham, Emily Calamari, Nicolas B. Cowan, Kelle L. Cruz, Eileen Gonzales, Mary Anne Limbach, Pengyu Liu, Evert Nasedkin, Genaro Suárez, Xianyu Tan, Cian O’Toole, Channon Visscher, Niall Whiteford & Yifan Zhou
-
The article Webb exposes complex atmosphere of starless super-Jupiter was published in ESA’s Webb website.